Discover, Engage,
& Convert Your Best Users
Leverage our AI-powered Offerwall to connect with millions of monthly active users and turn them into loyal customers.
Get Started
Leading Brands Trust Fluent to Power their Marketing Strategy
A Winning Formula to Fuel Your Acquisition Strategy
Incremental Inventory
Expand your reach beyond mainstream channels with exclusive ad inventory.
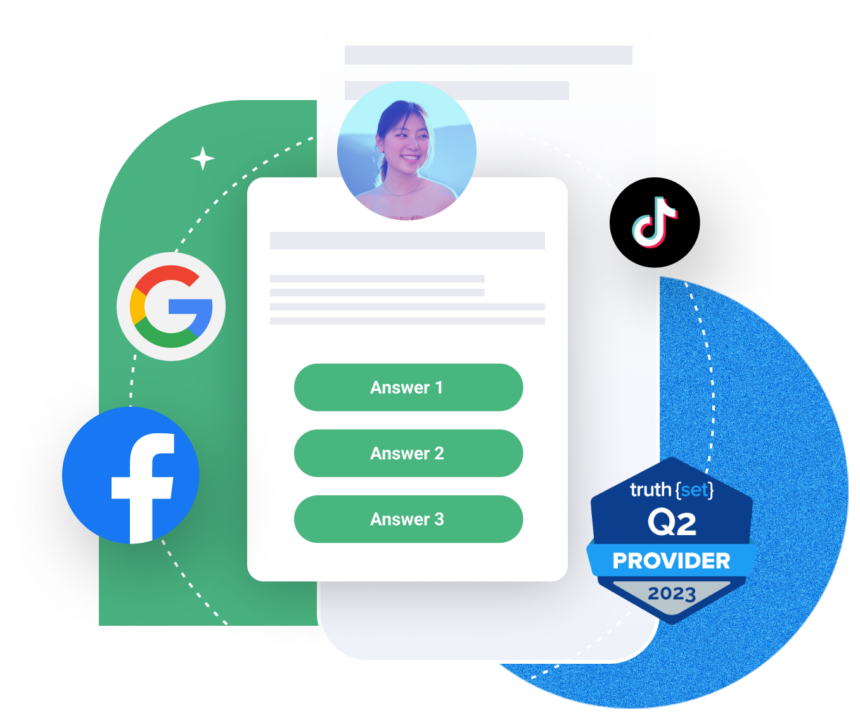
Premium, High-Intent Audiences
Reach pre-qualified consumers ready to discover new apps, merchandise, and experiences.
Performance-Based Pricing
Leverage CPI and CPE pricing to maximize your budget and tie ad spend directly to revenue.
Exponential Engagement on iOS & Android
Unlock rewarded traffic with Fluent’s privacy-forward approach to mobile web.
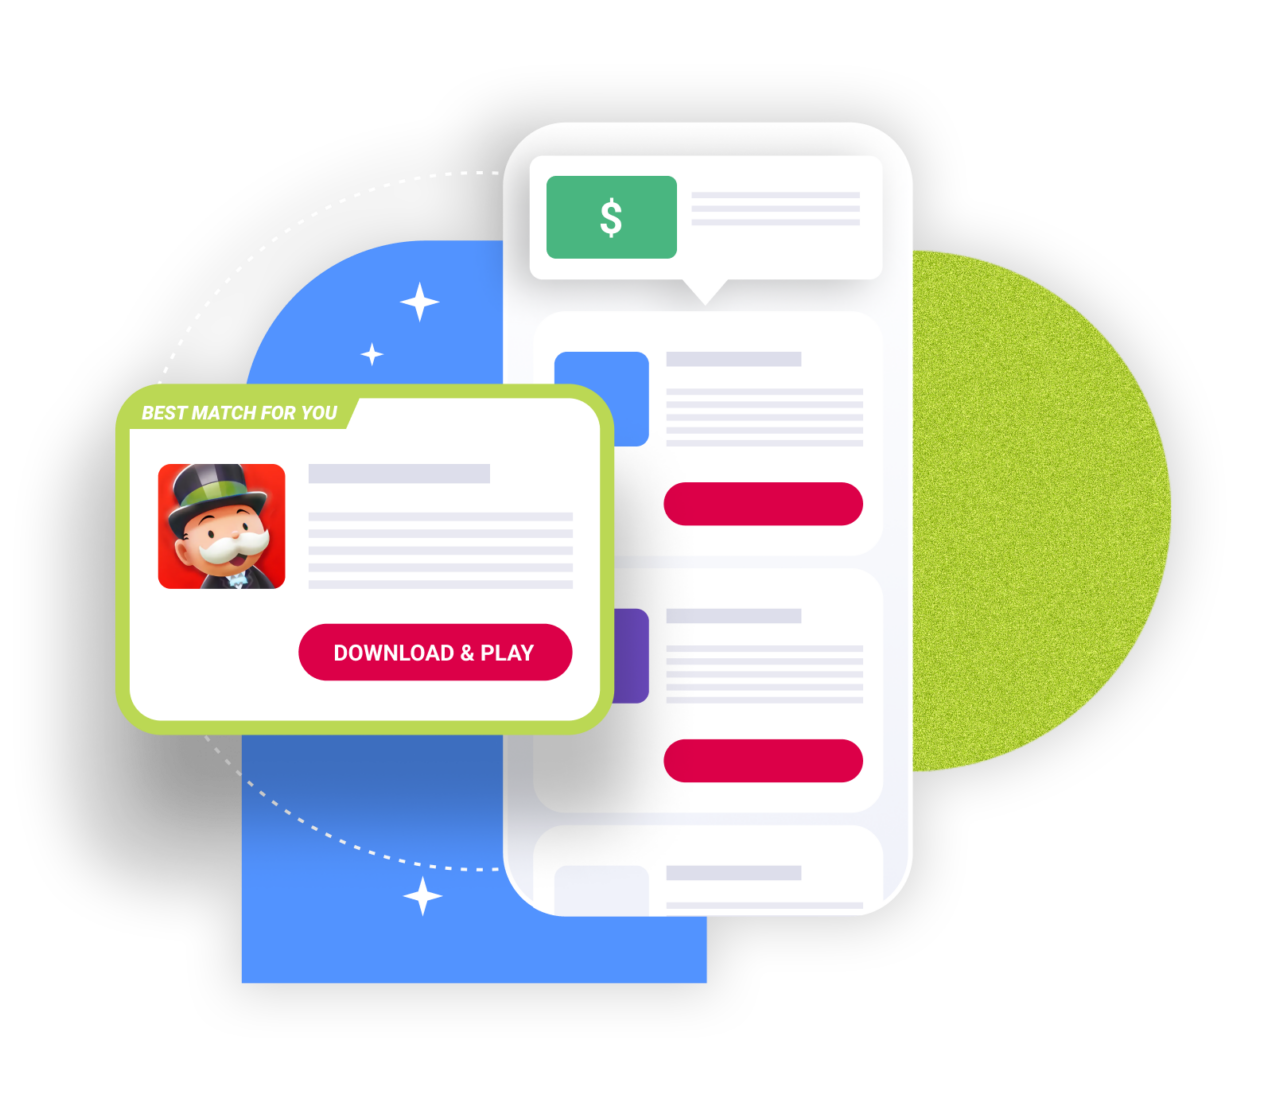
Drive App Installs Subscribers Streaming Trials In-App Purchases Loyalty Members with Offerwall Ads
Our AI-powered Offerwall connects you to millions of monthly active users ready to discover new products and services. Users voluntarily engage with ads in exchange for rewards, which means you only connect with high-intent audiences with an active interest in your brand.

Maximize Your Budget
- Pay for conversions and increase retention with CPI and CPE pricing models.
- Design multi-event campaigns to drive deeper funnel engagement and high LTV customers.
- Track campaign performance via integrations with Adjust, AppsFlyer, Kochava, and Singular.

Unlock New Audiences
- Connect with high-intent audiences ready to discover new brands and offers.
- Reach mobile web users you won’t find via in-app ads.
- Unlock rewarded traffic on iOS & Android with Fluent’s privacy-forward inventory.

Achieve Your ROAS Goals
- Leverage our dynamic ROAS optimization technology to acquire your best customers, faster.
- Use in-depth audience insights to deliver personalized offers and maximize conversions.
- Partner with our team of experts to optimize your budget and refine your targeting strategy.
We Deliver Proven Results, Making Our Partners Look Good
16MM+
Mobile gameusers*
3MM+
Subscriptionsign-ups*
2MM+
Streamingtrials*
*in 2023
In Good Company


 Get Started
Recognized by the Best in the Business
AppsFlyer Performance Index
#1 Fastest-Growing Mobile Media Source in North America
Singular ROI Index 2024
ROI Index: Top 25 globally in gaming and overall
Retention Index: Top 15 globally
Retention Index: Top 15 globally
Adjust Partner Benchmark Report
#1 Fastest-Growing Mobile Media Source in North America
Fueling Success for Partners Since 2010

Rewardify Exceeds ROAS Goals by 30% with Fluent’s UA Solutions for Mobile Gaming
Read the Success Story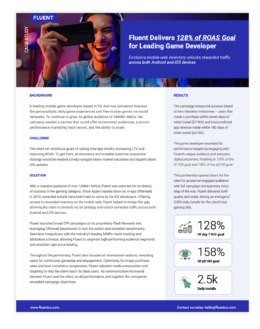
Fluent Delivers 128% of ROAS Goal for Leading Game Developer
Read the Success Story
Wait there's more!